← Portfolio
Data Journalism2017
Our Grenfell
Prompted by the 2017 Grenfell Tower fire in London, a series analyzing large-scale fire risk in Seoul through data. Combined R/Python analysis, an interactive map, visualizations, and video into a multi-format piece that accumulated 500,000+ views.
Challenge
Fire risk information was scattered across statistics and regulations. Listing numbers meant nobody would read it. Citizens needed to be able to check their own neighborhood's risk directly, while structural flaws needed to be pinpointed with data.
Approach
1
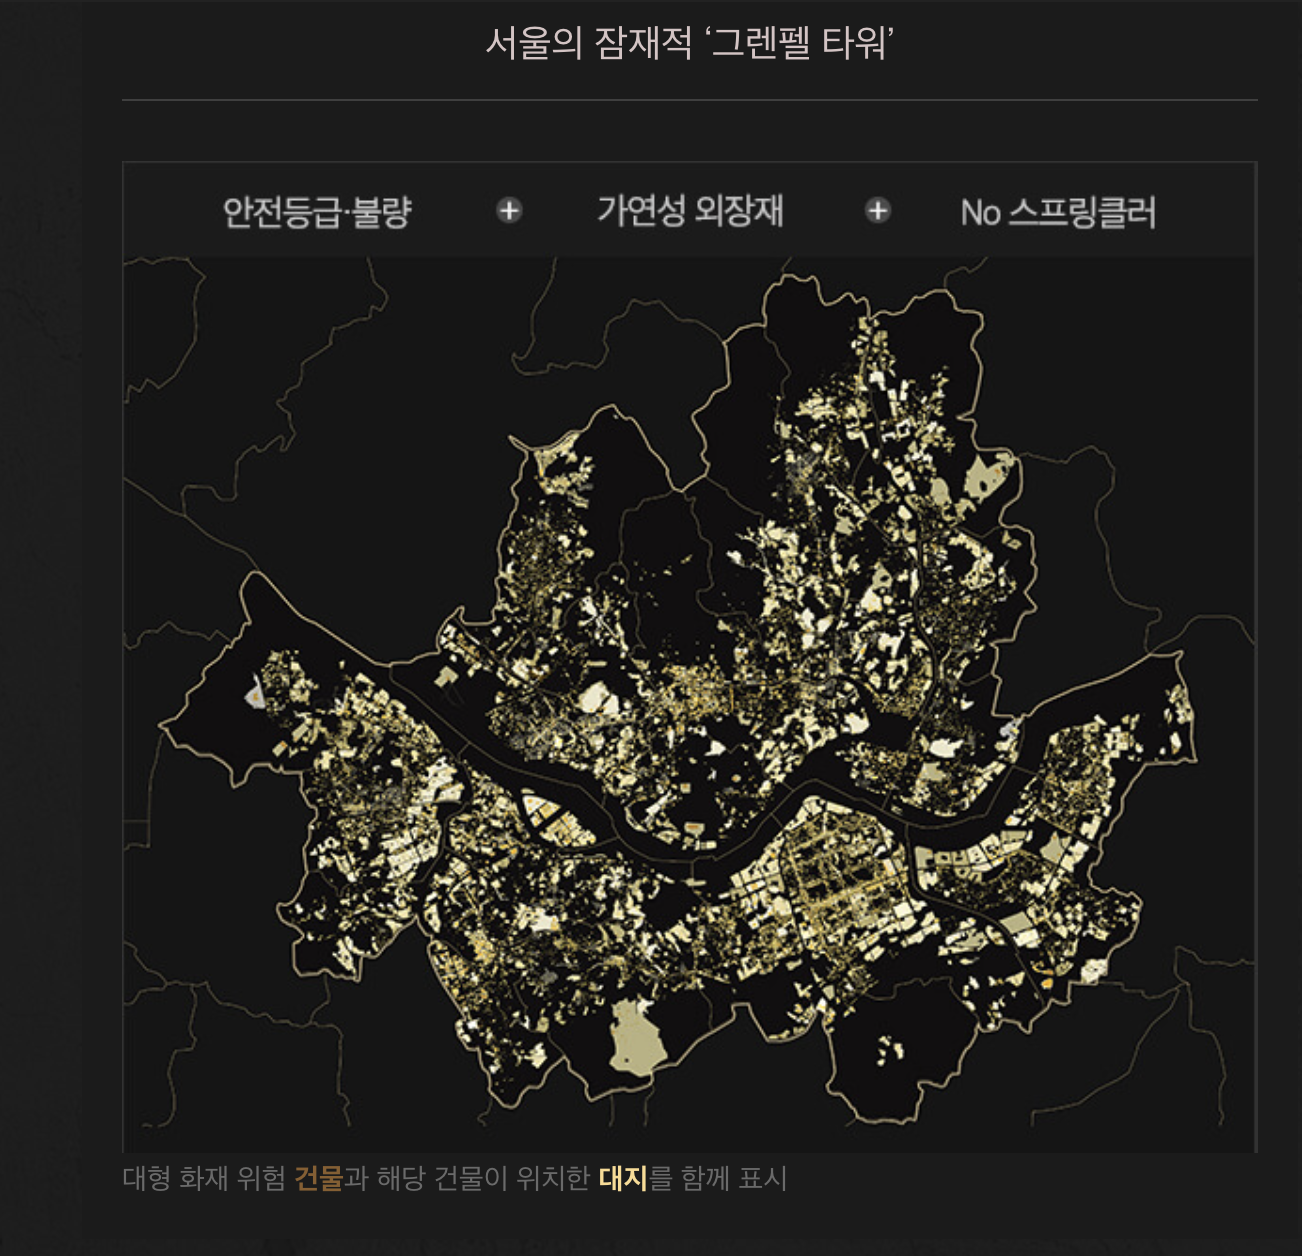
Led with a "Check Your Neighborhood's Fire Risk" interactive Seoul fire risk map as a hook to draw audience interest2
Collected and analyzed full Seoul fire risk data with R and Python — cross-referenced 3 conditions: poor safety rating + combustible cladding + no sprinklers3
Collaborated with data visualization team (Codenamu); PM'd a 4-person team including designer and developer4
3-part series: I. Buildings That Catch Big Fires Are Different / II. Firetrucks Want to Run / III. The Secret of the 15-Floor ApartmentWork
Outcome
✓
500,000+ cumulative views✓
Triggered follow-up reporting by other outlets, led to policy discussions✓
2017 Korean Online Journalism Award — Data Journalism Grand PrizeTags
DataJournalismRPythonInteractivePublicInterestJournalism