The Collapse of the Normal Distribution and the Age of Power Laws
Why the normal distribution no longer explains many parts of today's world, and why power laws, extremes, and winner-take-all dynamics matter more.
The Collapse of the Normal Distribution and the Age of Power Laws 2016. 1. 27.
Statistics has something called the normal distribution — one of the most important concepts in statistical analysis.
The shape of the normal distribution is symmetrical around the mean. Many natural phenomena, such as human height and weight, follow a normal distribution. As shown below, the distribution takes the shape of a hat (or a boa constrictor swallowing an elephant, as in The Little Prince), centered on the mean. 68.3% of values fall within the center, and 95.4% fall within two standard deviations.
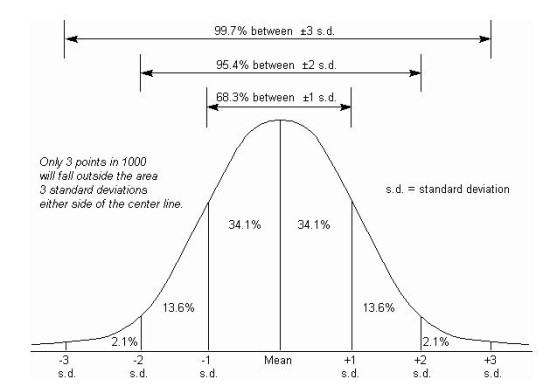
This means that if you randomly pick someone from a group of 100 and measure their height, 96 out of 100 will fall within the expected two-sigma range, with only 4 as outliers. We call this a "normal" distribution because this state is closest to what we consider normal.
However, the world we actually live in produces far more abnormal situations than normal ones. The most familiar example is the distinction between permanent and non-permanent employment. Last year in Korea, irregular workers accounted for 32.5% (6.27 million people) of all wage earners. This is not a normal structure. In the name of "flexibility" and "competitiveness," the normal distribution curve that guarantees social stability has been twisted and distorted.
Being in an abnormal situation means your ordinary life is under threat. Full-time workers earn an average of 2.7 million won per month, while non-regular workers earn only 1.46 million won — just over half (54.4%). Since the rate of wage growth is higher for permanent workers, the gap will only continue to widen.
An article published in the Kyunghyang Shinmun titled "This Is How Unequal Our Incomes Are" starkly illustrates the distortion of average income. An illustration that lines up everyone earning money in Korea reveals the abnormal state of our society in an intuitive way. If income were represented as height, the average would be 175 cm, but there would also be a giant standing 1,227 meters tall.
This can be understood through the statistical concept of the power law. The power law is a seemingly strange mathematical pattern — it can be called the statistics of "the rich get richer." The phenomenon of major cities growing ever larger, and of popular figures on social media becoming even more popular, are classic examples of the power law in action. As the Kyunghyang Shinmun pointed out, in today's capitalism, wealth begets wealth. Giants grow taller faster, while the small are left malnourished. The "spoon theory" (the idea that your life outcomes are determined by the class you were born into) that dominated Korean social discourse last year is very much connected to this context.
What's interesting is that this mathematical pattern is called the power law. The word "power" can also mean authority or dominance. The concentration of power is what bends the normal distribution curve into the world of power laws. The age of the power law — in other words, the age where power = law. This signals the collapse of the normal distribution and symbolizes an era that is anything but normal.